Features
#GrowOnlinewithChinny: Understanding Instagram Analytics + How to Get your First 100 Followers
Hi guys,
I have really exciting news! In a bid to share tips that will help you reach your goals of successful social media marketing, I’ll be interviewing an interesting mix of business owners and social media experts on #GrowOnlinewithChinny.
The best part? These guests own brands, run multiple businesses, and have mastered the art of scaling on social media. I’m really excited about these interviews, and can’t wait for them to be out!
Today, let’s talk about Instagram analytics…
Monitoring your Instagram analytics is great at helping you decipher why some posts perform better than others.
To get started, tap the three-dash icon at the top right corner of your Instagram profile, and click on ‘Insights’. This takes you to the ‘Activity’ page which is a general overview of your account. Here, you’ll see the total number of interactions on your page.
This is a weekly log of actions taken on your posts, and the number typically higher when you upload new posts. Here, you can also track the number of profile visits, and the other call-to-action buttons included in your profile (website clicks, emails, calls, get directions, etc.) Instagram also helps you measure this performance against the previous week.
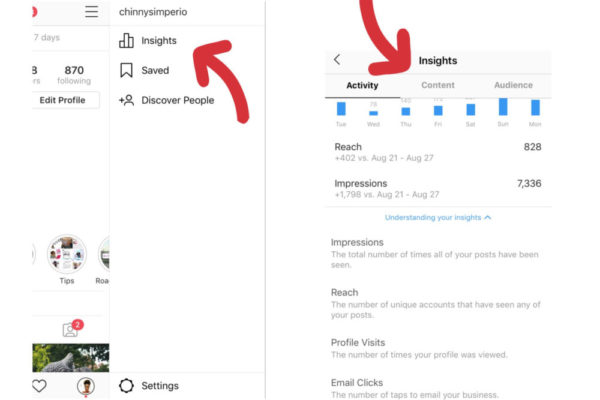
Scroll down and you’ll see ‘reach’ and ‘impressions.’ There is a big difference between these two and I advise that you keep close tabs on your reach. Reach is the number of UNIQUE ACCOUNTS that have seen any of your posts in the past week while impressions tell the total NUMBER OF TIMES all your posts have been seen that week. One of your social media marketing goals should be to increase your reach. If you have 1,000 followers and only 100 unique accounts saw your posts in a week, you know you have to fix up.
The Content Tab
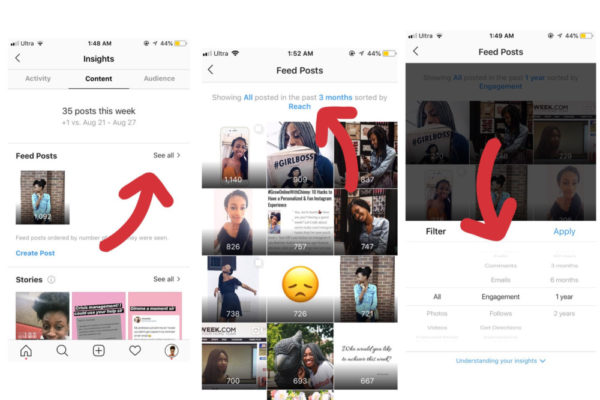
The first thing you’ll see is your total number of posts (feed posts + stories) and how that compares to the previous week. Next in line is ‘Feed Posts’, where you want to click ‘See all’ and this is where we get to work.
Right now, mine reads ‘Showing ALL posted in the past 1 YEAR sorted by ENGAGEMENT’. You can modify any of the words in caps by clicking on it, to suite the metrics you need. See what I mean:
Type of post: All, Photos, Videos, Carousel Posts, or Shopping Posts.
Metrics: Website Clicks, Calls, Comments, Emails, Engagement, Follows, Get Directions, Impressions, Likes, Profile Visits, Reach, Saved, Outbound Clicks, Product Opens, Texts.
Period: 7 days, 30 days, 3 months, 6 months, 1 year, 2 years.
The metrics that will matter most to you will depend on your marketing goals. For example, do you want customers to ‘Get Directions’ from your Instagram profile? For accounts with the shoppable tag feature, ‘Product Opens’ will be a very important metric. Generally, I pay a lot of attention to:
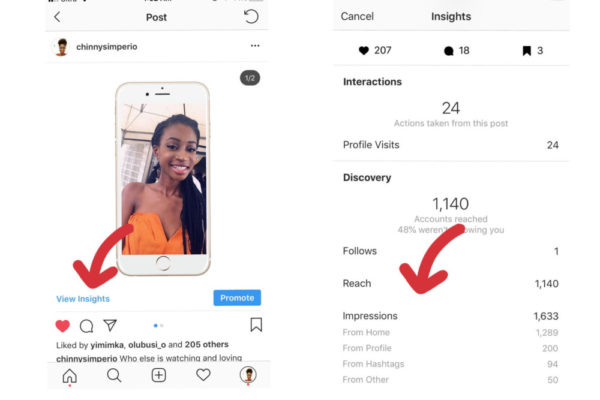
Reach/Follower Ratio: the number of unique accounts that saw my post vs. number of followers. Open the post with the highest and click ‘View Insights’, this gives a detailed breakdown of likes, comments and how many times your post was saved. You can also see the number of profile visits and where your impressions come from. Homepage? Hashtags?
Like/Reach Ratio: the number of people that double tapped vs. the number of people that saw your post.
Engagement/Follower Ratio: the number of likes + comments vs. number of followers. You should definitely keep an eye on this every week.
If you have a website that you want Instagram to drive traffic to, your ‘Website Clicks’ will be important to track.
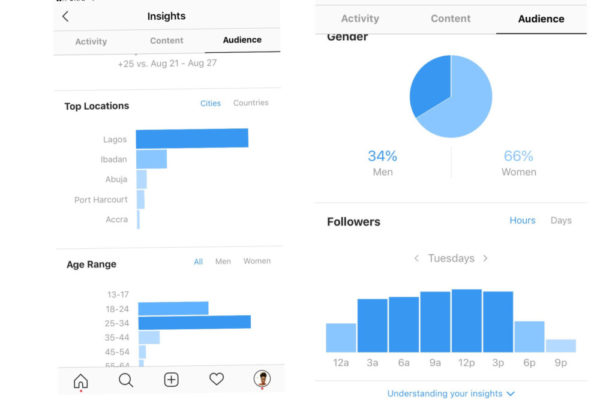
Hello Audience!
Under this tab, the first thing you can see is whether you gained or lost followers over the last week. You can track the top cities and countries your followers are concentrated, as well as their gender and age distribution. Also, Instagram shows you the average times your followers are active on Instagram on a typical day, and the days of the week that they are most active. That’s just some real time expo on the best time to post!
The only downside to Instagram analytics? It is only available to you if you have at least 100 followers on Instagram. 100 might seem like a small number, but what happens when you’re just starting out on this Instagram journey. A few things to work your way up to 100.
- Tell your friends to follow you on Instagram. Nothing beats that word of mouth!
- Put it on your WhatsApp status, include the link to your Instagram bio. Links are clickable from your WhatsApp status.
- Set up your Instagram profile completely and be sure your bio clearly defines your brand.
- Make sure your first few posts are great pictures with interesting captions that tell a story about you.
- Link your Instagram account to your Facebook page (open one if you don’t already have one) and run an Instagram ad. Instagram is a business that makes money from ads, so ads actually work. The best part is you can set your audience, goals and budget (start with N1,000 for 24 hours and see the results you achieve).
In addition, apps like Buffer, Hootsuite or Later, help you measure your Instagram metrics but Instagram provides really good insights that you should be maximizing.
Hope this post helps you understand Instagram analytics better. Got questions or comments? Please drop them below and tell me, are you excited for my upcoming interviews? Want to connect on Instagram, follow me @chinnysimperio
Xoxo